Results & Plots
After running the analysis, the results panel displays stress/strain distributions and margins of safety.
Stress & Strain Plots
The primary plot shows the variation of a selected component around the hole boundary (0° to 360°). You can toggle between:
- Strain X (εx) — Normal strain in the x-direction
- Strain Y (εy) — Normal strain in the y-direction
- Strain XY (γxy) — In-plane shear strain
- Stress X (σx) — Normal stress in the x-direction
- Stress Y (σy) — Normal stress in the y-direction
- Stress XY (τxy) — In-plane shear stress
All values are evaluated at the hole boundary (r = D/2).
Margin of Safety
Margins of safety are computed for each unique ply angle in the laminate. The hole-boundary strains in the global (x-y) coordinate system are rotated into each ply’s fiber coordinate system (1-2), and then compared against the ply-level strain allowables.
Two margin types are evaluated at every point around the hole:
- Tension/Compression Margin— Based on the fiber-direction strain (ε₁). If ε₁ > 0, the tension allowable is used; if ε₁ < 0, the compression allowable is used.
- Shear Margin — Based on the in-plane shear strain (γ₁₂) compared to the shear strain allowable.
The critical margin is the minimum margin across all ply angles, all hole-boundary angles, and both margin types. A positive critical margin means the joint passes; a negative margin indicates failure.
Contour Plot
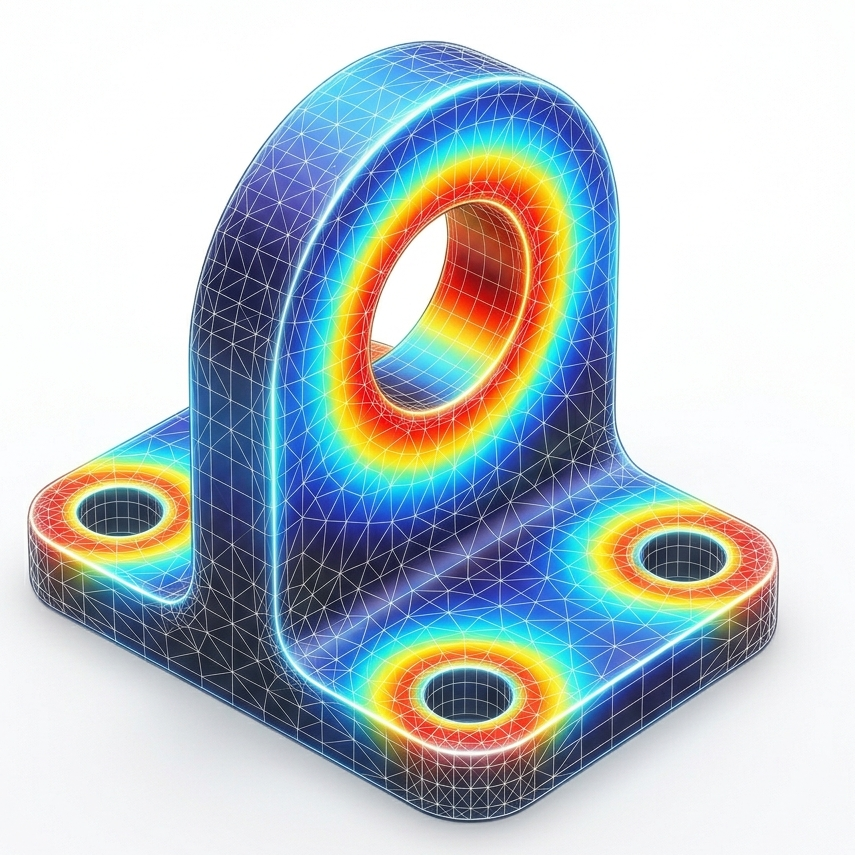
When available, a 2D contour plot is generated showing the selected stress or strain component as a color map around the hole. This provides a visual representation of the stress field, making it easy to identify hot spots and load paths.